The Roads Remember
Permits, people, and pet shops
I recently listened to a radio 4 podcast named “Highways to Hell”, which covered various street & road work related issues, and then did what any sane person would do… went on t’internet and analysed around 5 years worth of Street Manager permit data (operational since July 2020).
The podcast highlighted several issues, many of which are also covered in the recent transport select committee report on managing the impact of street works1.
Street and Road works (they are separate things) 2 are heavily regulated, and the report does contain a lot of industry jargon, but I still suggest reading it for more details.
However, here’s the gist of it.
People are increasingly feeling the impacts of street & road works:
-
For drivers: congestion, closures, delays
-
For businesses: lost trade
-
For residents: reduced accessibility, deteriorating pavements
-
For local authorities: deteriorating road conditions
People feel frustrated by a lack of communication and visible coordination:
-
One utility working in the road, and then another utility company working in the same road a few weeks later (Same street, multiple disruptions. Although I should point out that a lot of good work is being done to create incentives for collaborative works behind the scenes - both carrot and stick).3
-
Feelings of frustration when motorists hit yet another road closure (or highly impactful traffic management such as multi-way traffic lights) in their local area (a point that was quite prominent in the highways to hell podcast).
Angela, a pet shop owner from Rochdale, was interviewed as part of the radio show.
Here’s what Angela had to say:
- Owned the pet shop for around 27 years.
- Frustrated by the continued presence of road works and temporary traffic lights.
- It has impacted her trade - a reduction in regular customers (about 10%) and wholesaler deliveries down from 3 to 1 a week.
- A customer also mentioned the nightmare of repeated lights and works.
And that’s just the anecdotal experience of 2 people.
Data can often be very abstract, but it can also be very meaningful.
One of the most powerful things you can do with data is link it right back to the real, lived experiences we have of the world around us - at the end of the day isn’t that what it’s all about?
So what does the data tell us about Angela’s story?
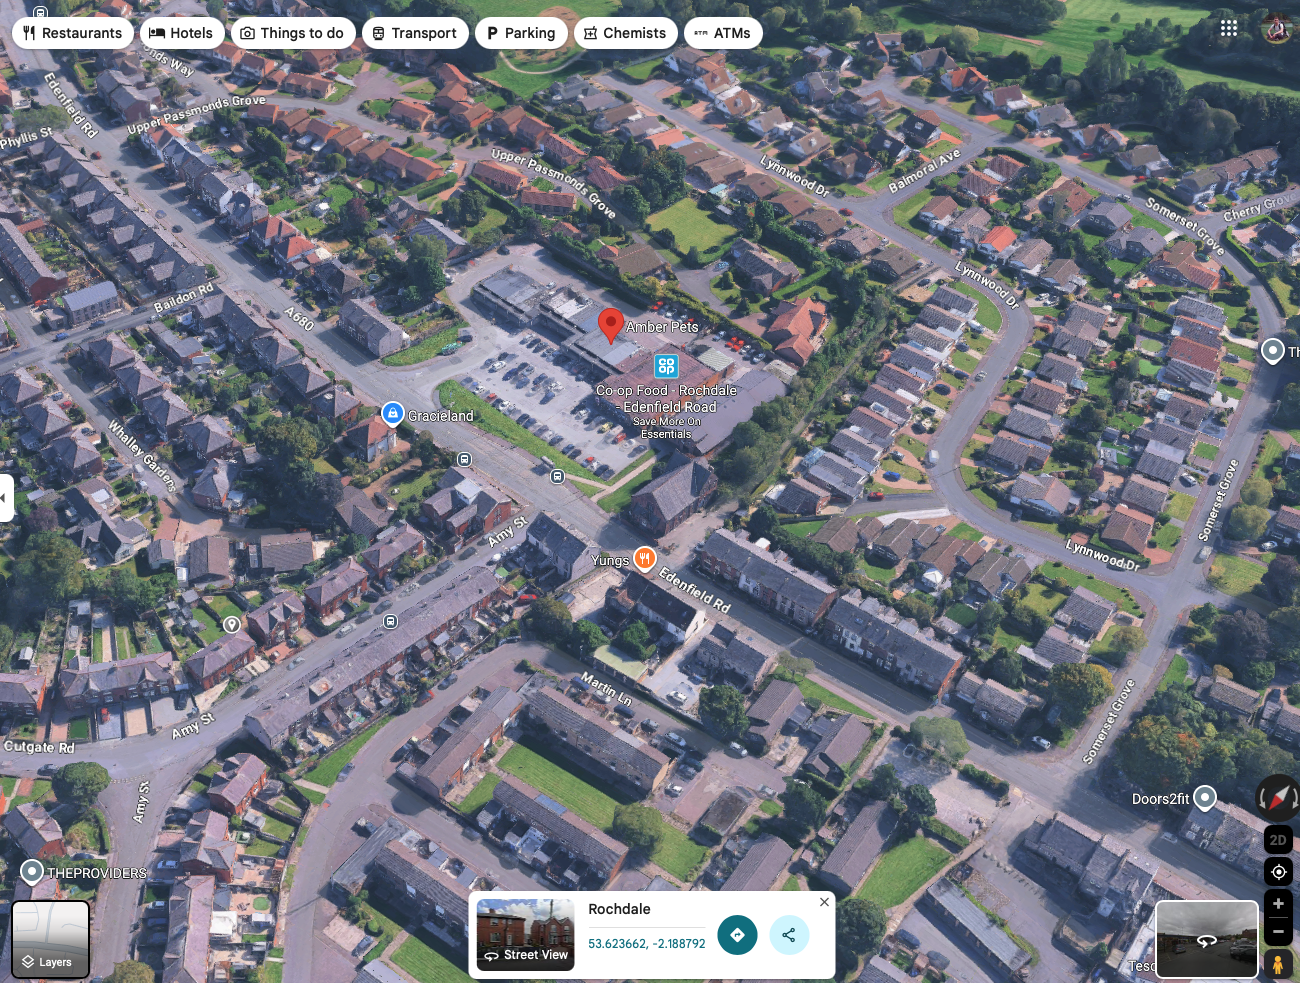
Angela’s pet shop is situated just off from Edenfield Road in Rochdale - that’s USRN 32000668 for the uber nerds among you.
If you have an OS DataHub4 account you can query the USRN for more info:
curl -X GET "https://api.os.uk/features/ngd/ofa/v1/collections/trn-ntwk-street-1/items/32000668" \
  -H "key: YOUR_API_KEY"
Edenfield Road (the eagle eyed will have already noticed the scarring from past utility works).
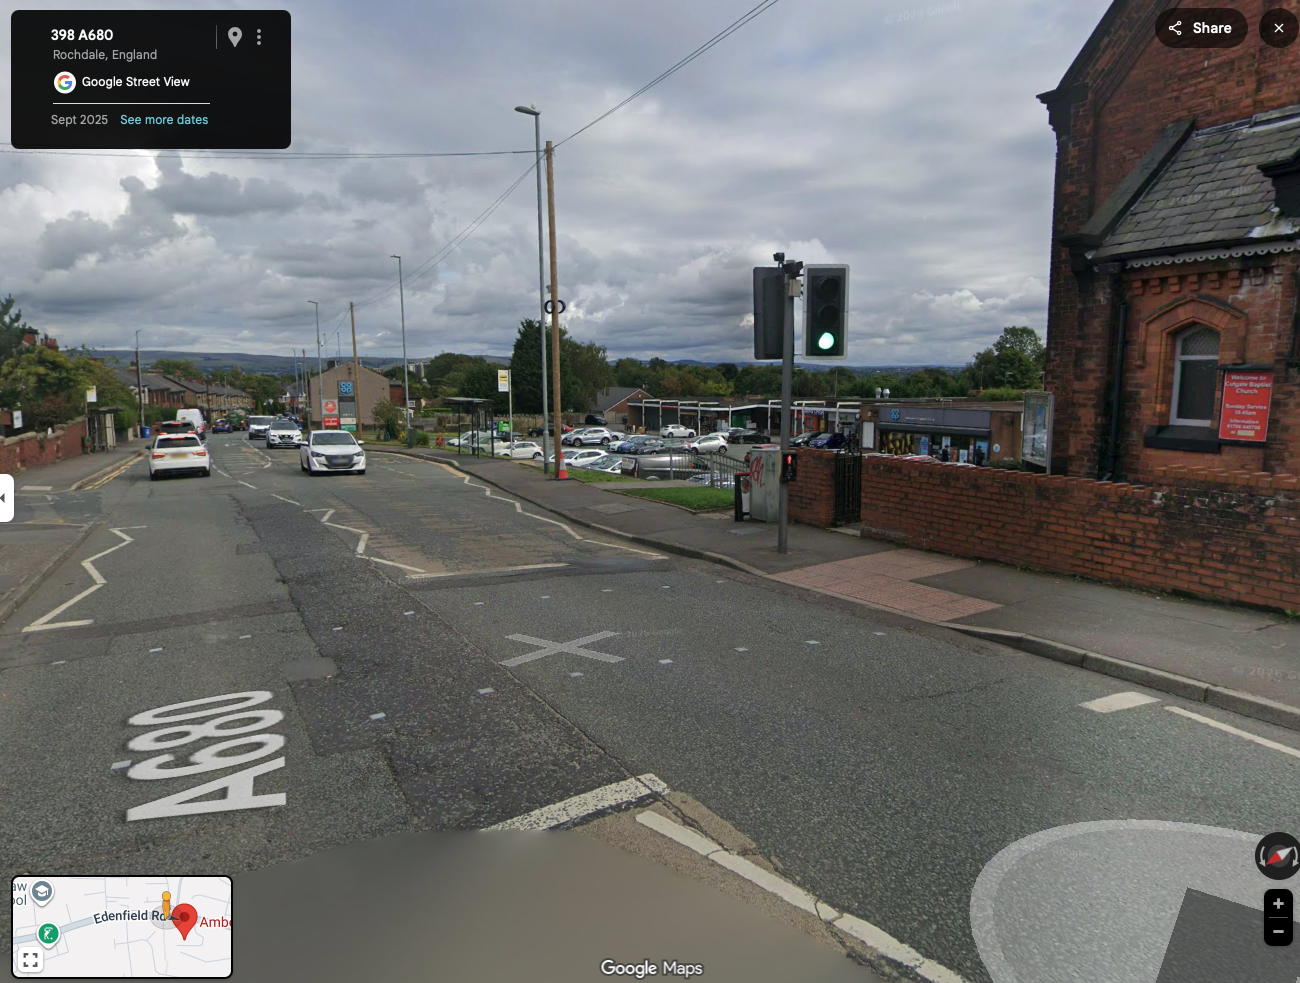 Source: Google Maps
 Source: Google Maps
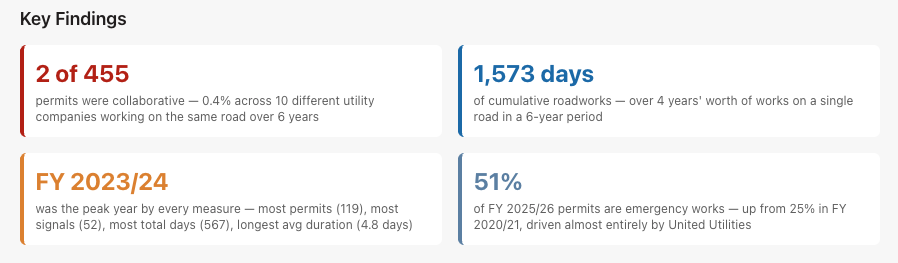
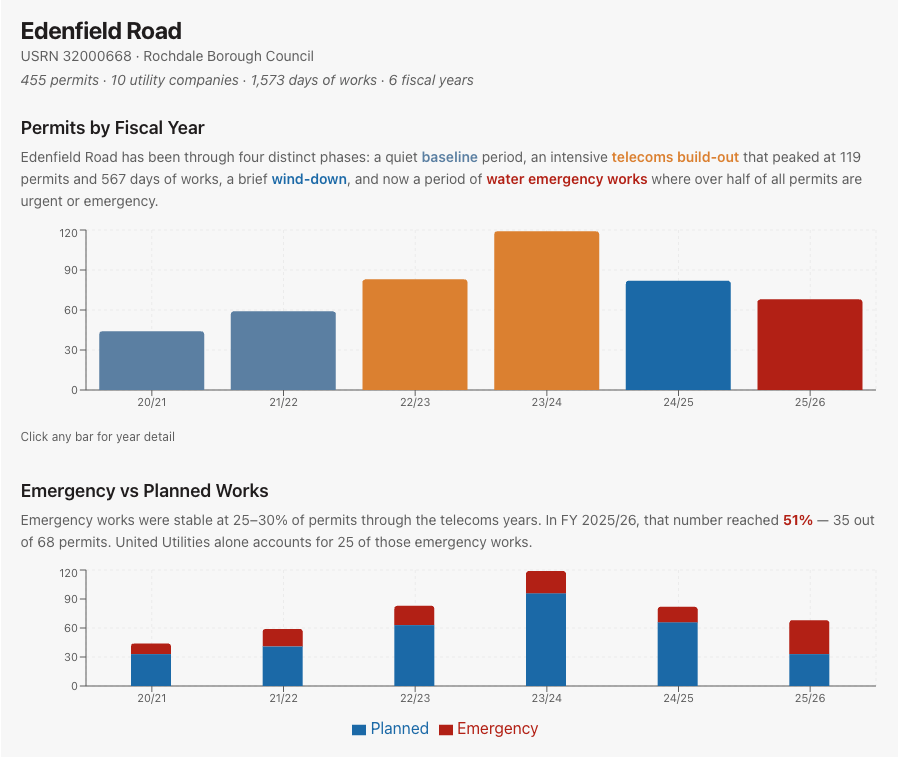
I gave the outputs of my analysis56 to Claude and the MotherDuck MCP server to create the visualisation below - using data I had already processed and modelled for this to work best.
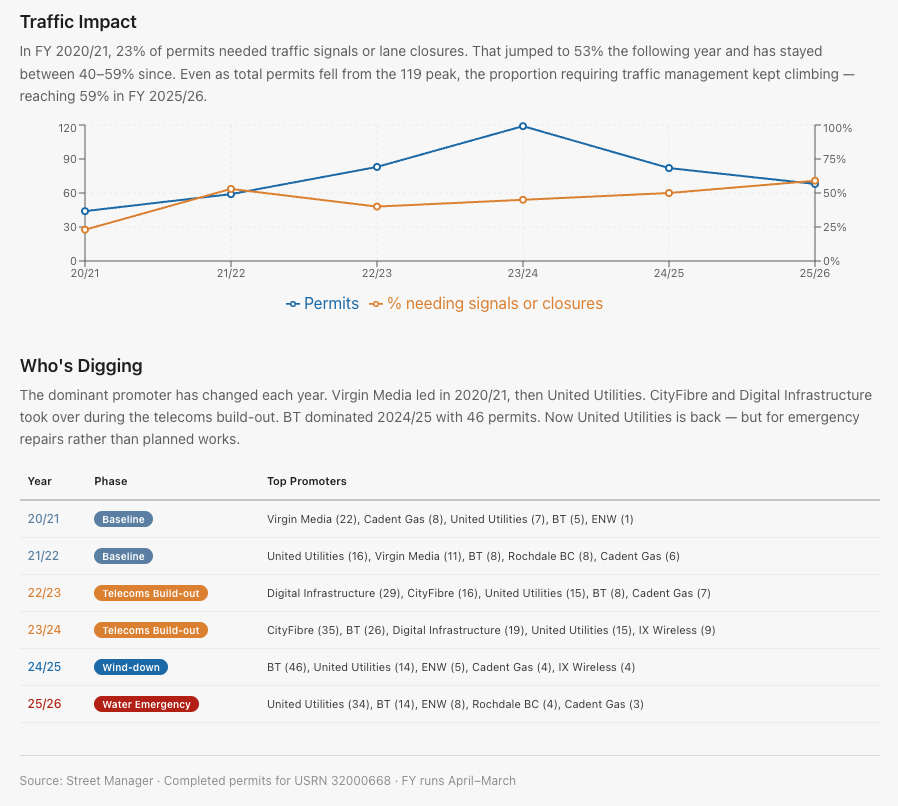
I’ll chime in with a couple of points too…
-
I find it interesting that there were only 2 permits marked as collaborative out of 455.
-
I also find it hard to believe that during the last 5 years there were no other opportunities to collaborate on a busy A Road in Rochdale.
-
As I said earlier, a lot of good work is going on behind the scenes to help promote collaborative working.
-
These approaches mainly focus on longer term, structural incentives built into regulatory cycles, leveraging the position of Mayoral authorities to help marshal the process.
-
This is no doubt very important for long term behavioural nudges, monitoring, and evaluation.
-
However, we should listen to Angela, I don’t think she should wait much longer for change - and those who care about winning the next election probably shouldn’t either.
-
And when I say change I don’t mean the AI gas town7.
-
Benn Stancil’s piece is worth reading. It’s about agents spawning agents spawning yet more agents, but the real point is the pivot at the end. While everyone’s locked in on their wee machines, caffeinated to the high heavens, vibe coding the future, there are still people out there who care about the less glamorous, mundane things happening outside their windows.
-
I think the same applies here.
-
We should go out, speak and listen to local people, use the operational data we have, find the roads (USRNs) impacted the most by street works, and do something about utility works on those roads.
-
We probably don’t need a hundred AI agents, elaborate regulatory incentives, and lane rental schemes galore to improve street works collaboration. I think we often repeat that we do because those are the signals that we need to send to others to be taken seriously.
-
If we can tell the story of Edenfield Road using the DfT’s open street manager data, we can find and tell the stories of all the other roads just like it.
-
And once we’ve found those roads, we have enough powerful, opinionated people and the industry organisations to do something about collaboration on them.
-
If anything, it’s about trying to drive some behavioural change through transparency and the constant interrogation of a shared source of information - the DfT’s open permit data.
-
Use the data to find the roads most impacted by street works. Publish a list of them every year. Ask the utilities and local highway authorities to prioritise collaboration on those roads where safe to do so. If they don’t, publish that too, and let them explain why to the local people in the area. Maybe they’ll have a good reason, maybe they won’t.
-
Let me stress, this isn’t about blame.
-
We have a massive centralised audit trail of every street work permit in England sitting right there, in the open, and free to use. We should use it to hold people to account, and drive better outcomes.
-
It’s not all doom and gloom though!
-
Stuff like this is a great example of collaboration in the sector8. Cadent and United Utilities in Wigan, using the same contractor with dual-skilled engineers to combine gas and water mains upgrades into one programme. Fair play. Hats off. Using a shared contractor is something that is really cool to see.
Right, we’ve chatted a decent amount about Edenfield Road, but what does the national picture look like? (England only).
I think there’s been a shift in the nature of street works across England and it’s worth noting for anyone who works in the sector.
Completed permit volumes have been relatively stable since FY 2021/22:
| Fiscal Year | Total Permits |
|---|---|
| FY 2020/21 | 1,353,267 |
| FY 2021/22 | 2,116,253 |
| FY 2022/23 | 2,211,712 |
| FY 2023/24 | 2,245,845 |
| FY 2024/25 | 2,162,432 |
| FY 2025/26 | 1,808,294 |
But road and lane closures are up across England:
| Fiscal Year | Road Closures | Lane Closures | Total Closures |
|---|---|---|---|
| FY 2020/21 | 84,929 | 32,490 | 117,419 |
| FY 2021/22 | 144,620 | 44,187 | 188,807 |
| FY 2022/23 | 146,995 | 45,565 | 192,560 |
| FY 2023/24 | 164,631 | 50,428 | 215,059 |
| FY 2024/25 | 198,434 | 52,676 | 251,110 |
| FY 2025/26 | 177,415 | 43,828 | 221,243 |
And immediate permits are up (noted in the select committee report too):
As defined in the select committee report: “Immediate permits, as defined in the Department for Transport’s statutory guidance for permit schemes, are issued by local authorities to cover either: emergency works, where immediate action is needed to prevent danger to people or property; or urgent works, where immediate action is needed to prevent a loss of the service provided by the utility company.” Urgent permits have been rising steadily while emergency permits have been falling - but together they still account for roughly a third of all works.
| Fiscal Year | Immediate Urgent | Immediate Emergency | Total Emergency |
|---|---|---|---|
| FY 2020/21 | 393,106 | 102,512 | 495,618 |
| FY 2021/22 | 565,856 | 175,999 | 741,855 |
| FY 2022/23 | 601,439 | 130,061 | 731,500 |
| FY 2023/24 | 668,281 | 121,417 | 789,698 |
| FY 2024/25 | 658,770 | 117,201 | 775,971 |
| FY 2025/26 | 533,167 | 89,929 | 623,096 |
Yet collaboration remains low overall (although this FY looks promising - will we surpass the 1%?):
| Fiscal Year | Total Permits | Collaborative Permits | Collaboration Rate |
|---|---|---|---|
| FY 2020/21 | 1,353,267 | 0 | 0.00% |
| FY 2021/22 | 2,116,253 | 1,359 | 0.06% |
| FY 2022/23 | 2,211,712 | 19,765 | 0.89% |
| FY 2023/24 | 2,245,845 | 18,904 | 0.84% |
| FY 2024/25 | 2,162,432 | 18,224 | 0.84% |
| FY 2025/26 | 1,808,294 | 16,441 | 0.91% |
In FY 2023/24, immediate permits hit 789,698 out of 2,245,845 total permits - about 35%.
The total volume of work doesn’t seem to be increasing.
However, the type of work, and the traffic management around it does look like it’s becoming more disruptive.
I think two factors are driving this shift:
-
Ageing infrastructure. Much of our underground infrastructure is old. For example, some of the pipes in the Cadent gas network data were commissioned in the 1880s.
-
New infrastructure that demands road space. Full fibre rollout. EV charging. Heat networks like the Leeds PIPES district heating network. Large redevelopments that need new substations9 and the cable routes to power them. These are necessary investments, but they require more disruptive works - and increasingly, full road and lane closures rather than other forms of traffic management.
With the National Data Library now in place, I’d love to see a workstream on how we can best use Street Manager open data to drive better outcomes in the utility sector. If anyone from the NDL team ever reads this, please consider this my consultation response.
Anyway, I’ll finish with this…
The roads remember, so do the people, and so do the pet shops.
Chris
Data Licensing
All data licensed under the Open Government Licence v3.0 (Street Manager data).
Footnotes
-
Google’s AI overview says: “Street works are conducted by utility companies (water, gas, telecom) to install or maintain underground apparatus, whereas road works are carried out by highway authorities (local councils) to repair or improve the road surface, lighting, or structure.” Looks good enough to me. ↩
-
You could argue that lane rental schemes are a bit of a stick, and collaboration incentives from the regulators are a carrot (although they’re not available to all utility companies just yet and are subject to specific criteria). There are also teams at the GLA, and more recently the GMCA, doing good work looking to promote, identify, and measure the successes of these collaborative street works backed by regulators. Ofgem has also decided to expand the Collaborative Streetworks financial ODI-F nationally for Gas Distribution Networks in RIIO-GD3, rewarding GDNs for undertaking streetworks projects in collaboration with other utilities. See the RIIO-GD3 Collaborative Streetworks ODI-F Governance Document. ↩
-
The DfT’s open Street Manager data is ingested into a fact and dimension data model built with dbt and automated via GitHub Actions. The pipeline pulls permit data, transforms it into analytical models, and refreshes on a monthly schedule. The outputs used here were queried from that model and passed to Claude for summarisation. I will be comparing my numbers to the numbers in the DfT select committee report and will probably write about it here soon. ↩
-
A note on methodology: my analysis focuses exclusively on completed permits. I’ve noticed that some analyses only look at permit submissions without accounting for those that were cancelled, revoked, or refused. I think it’s always important to state this when looking at permit data. Disclaimer: This is entirely my own independent analysis. No organisation, employer, or individual endorses or is affiliated with this work. It is based on open data and my own interpretations, which may contain errors or inaccuracies. ↩
-
Wigan Today and LinkedIn. ↩
-
Canada Water Masterplan - AECOM and Transformer delivery marks Canada Water masterplan milestone - UK Power Networks ↩