Permits, permits, and more permits...
Deriving insights from Street Manager data
Overall, there are around 3 million permits raised every year in England for street and road work purposes.1
This is closely linked with another interesting fact:
“Each year, 4 million holes are dug (around 1 every 7 seconds) to install, fix and maintain the pipes and wires buried underground—assets that are critical in keeping the water running, gas and electricity flowing and our telecommunications lines connected.”2
The pace and scale of this activity is immense, whether it be for the purposes of:
- Maintaining the highway
- Repairing old gas mains
- Maintaining the water and sewage networks
- Increasing local electricity supply
- Rolling out full fibre
- Installing new infrastructure such as EV charge points and/or Heat Networks
- And much more
Absolutely everyone depends on street and road works in some way, shape or form.
Street and road works have been a huge interest of mine for several years now and I have been lucky enough to work in roles where I get to dig into the details of how the sector works:
- As a Senior Policy advisor for the National Underground Asset Register
- As a Senior Project Officer for the GLA’s Infrastructure Coordination Service
- As a Streets Data Scientist at GeoPlace (my current role)
I wanted to write a short article and share some of my experiences trying to make sense of what goes on in the sector with the data that we collect about it.
Note: The focus of this article is England as street/road works are managed differently in Scotland, Wales, and Nothern Ireland.
How Street Works Are Managed
For those of you who might be new to street and road works, here’s a very simplified explanation of how we manage and track what goes on:
Introduced through the Traffic Management Act 2004, local highway authorities in England run things called “permit schemes”.
Permit schemes essentially provide an administrative front door for anyone who wants to conduct activities on the highway in a particular area. These activities can range from utility infrastructure works, road closures, highway resurfacing programmes, and even skips!
Every activity is tracked through a permit:
- Permits are allocated reference numbers
- Permits go through a lifecycle (submitted, granted, works started, works ended, refused, cancelled)
- Permits can have things attached to them like inspections (and fines)
- Each part of the permit lifecycle, and its associated activity, generate millions of transactions
All of these transactions are logged and tracked centrally via a system called Street Manager managed by the Department for Transport.
All permits are logged against Unique Street Reference Numbers (USRNs) and their associated Local Highway Authority which allows permit activity to be grouped and tracked accordingly.
Note: USRNs aren’t the subject of this article but they’re a vital part of how we map and maintain a legal representation of our highway network. They live in the National Streets Gazetteer, which forms the legal basis for what parts of the Highway need to be permitted via Street Manager.
Every month the DfT provide an archive of every event that has taken place in the Street Manager system the previous month (in September you get August’s data). Depending on the month, you can get anything between 900,000 to 1.2 million individual events.
Making Sense of the Data
But all these transactions in the system… what do they look like?
A big, fuzzy mess to start with.
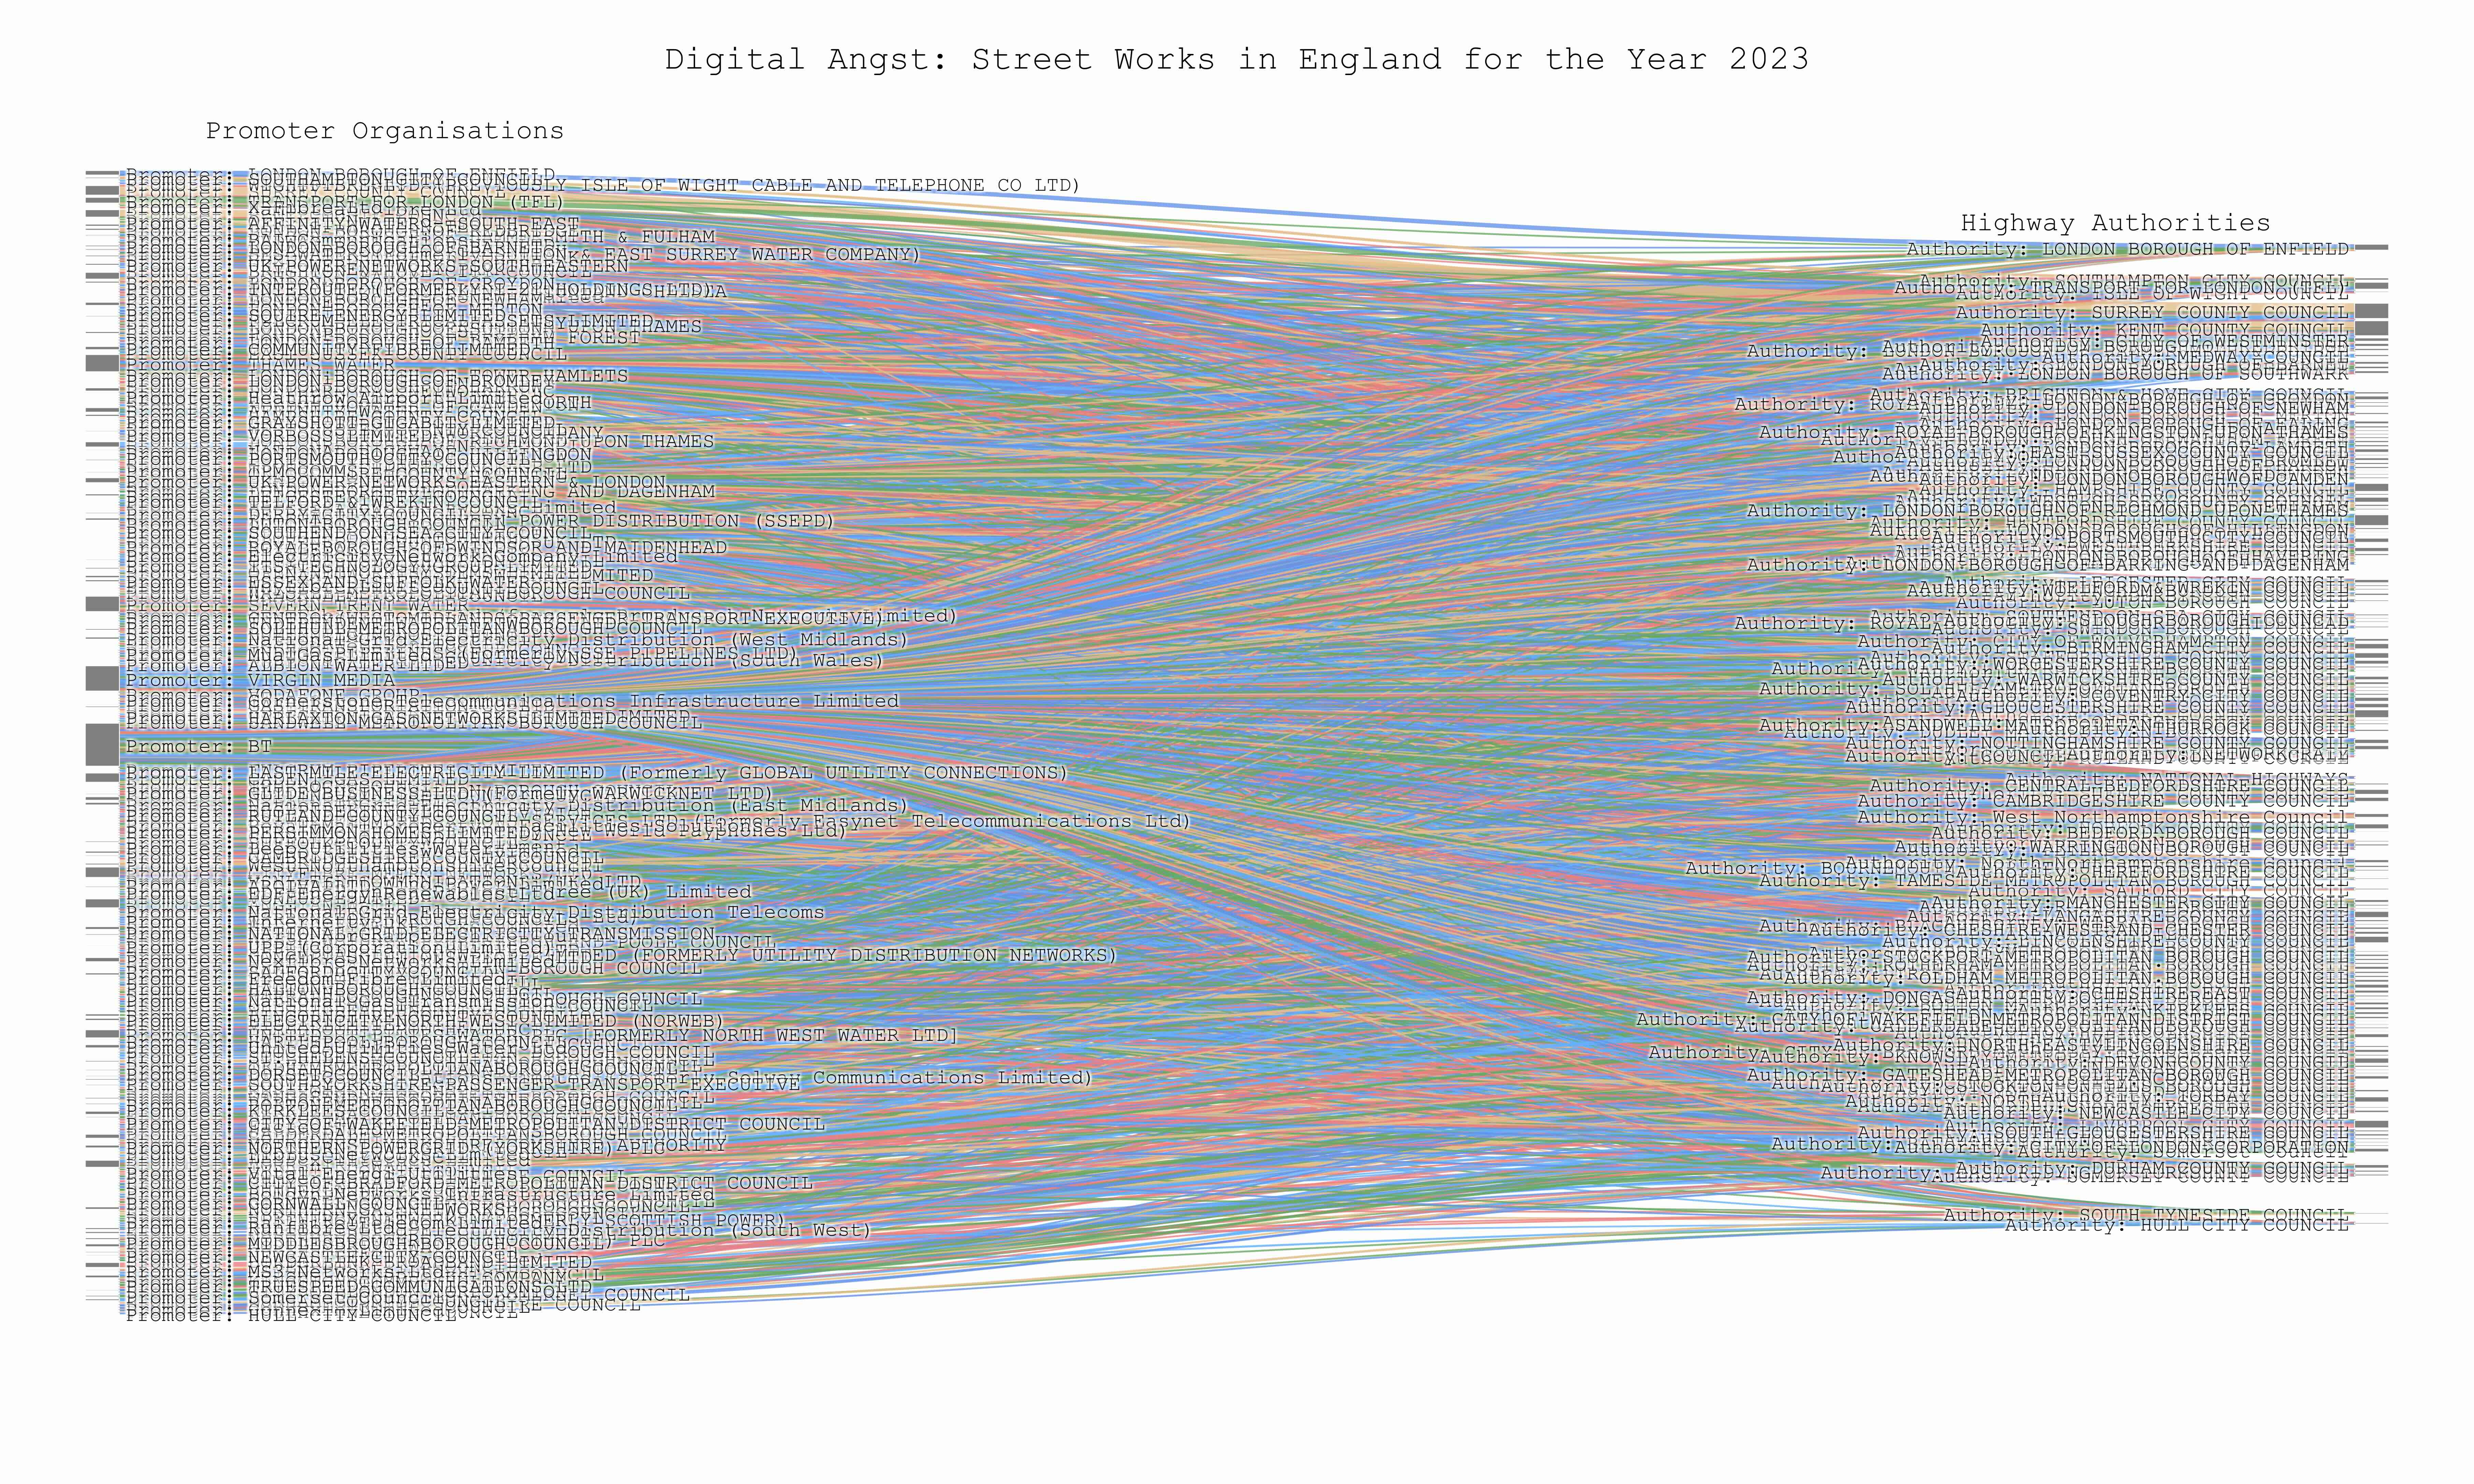
Above is a data visualisation that I coded up a couple of years ago to show an old colleague just how enmeshed everything can seem when you first start to think about deriving insights from the data that Street Manager holds.
On the left are all the organisations with completed permits in 2023 and on the right are the local highway authorities in which they were completed.
In its current state it’s not much use, although I do often look back at this image to remind myself just how blurry, confusing, and sometimes frustrating things can be when you first attempt to understand a complex data problem—or any problem really.
I called it Digital Angst for that very reason!
Now… how do you get from that messy image to a statement like:
“In September 2025, the estimated total wellbeing impact on local residents in Highway Authority A due to Organisation B’s utility works totalled £X.”
The answer is copious amounts of Yorkshire tea (why would you drink anything else?) and chocolate digestives.
On a serious note, you need:
- A formula to turn the social wellbeing impact of street works into pounds and pennies.
- Additional open datasets.
- A way to bring both things together.
The Wellbeing Valuation Methodology
Thankfully, the hard work to come up with an answer for the first bullet point has already been done for us.
In 2019, a company called Simetrica-Jacobs conducted a study called: “Valuation of the impact of works disruptions and supply interruptions using the wellbeing valuation method”.
The aim of the study was “to assess the impact of works disruption and supply interruptions on the subjective wellbeing of SGN customers and to derive an implied valuation for such impacts.”3
It’s a very detailed study so below is a very simplified overview of it.
What the researchers did:
-
Utilised a wellbeing valuation methodology to assess the monetary impact of works disruption and supply interruptions on customer subjective wellbeing (SWB).
-
Linked two large datasets by matching SGN incident data (location and timing) with the subjective wellbeing scores (primarily life satisfaction) of over 110,000 individuals in the ONS Annual Population Survey (APS). The core of the methodology relied on matching the timing of the SGN incident data with the interview dates from the Annual Population Survey (APS). Since works data often lacked postcodes, they used the Royal Mail Postal Address File (PAF) to match street names to postcodes.
-
Compared two groups of people: those living near the works (within a 500m radius) versus a similar control group that had no works near their home.
-
Identified a statistically significant negative association between works disruptions and subjective wellbeing, confirming that these incidents impose a cost on nearby residents.
-
Monetised the negative wellbeing impact of works disruptions, resulting in an implied total cost of £54,494 per average incident (aggregated across all affected households) or an equivalent cost of approximately £1.61 per day for the average affected household - within the 500m radius.
This methodology is still actively used by organisations working in the utility industry today and is often used as follows:
Impact Formula:
Impact = £1.61 × Duration (days) × Households (within 500m)
The £1.61 represents how much someone would be willing to pay to avoid the disruption caused by the works.
Building My Own Analysis Pipeline
I wanted to build on this methodology and create a way to estimate the same monetised wellbeing impact for every in progress and completed major and emergency work recorded in Street Manager on a monthly basis.
Like I said, how do you get from that messy image earlier to a statement like: “In September 2025, the estimated total wellbeing impact on local residents in Highway Authority A due to Organisation B’s utility works totalled £X.”?
Here’s how I do it:
1. Start with the wellbeing valuation study and use their wellbeing formula - mainly the £1.61 per household per day willingness to pay figure.
2. Uplift this to 2025 prices: Adjusted for inflation from £1.61 to £2.10 (using the CPI index).
3. Ingest Street Manager data monthly: pull in all permit events from the archived data on a monthly basis.
4. Filter for the big stuff: Only keep major and emergency works, marked as either completed or still in-progress.
5. Calculate work duration: If I’m focusing on September 2025, and a permit spans multiple months, I only count work days in the month being analysed. Works starting and ending in the same month I use the full duration. For works still in progress I assume that they’d last 7 days (my arbitrary assumption).
6. Use the work location coordinates: This is information contained in each permit.
7. Create 500m buffer zones: Calculate circular buffers around each work location - the SGN research showed this as the disruption distance that matters.
8. Bring in Ordnance Survey Code Point data: This provides a way to plot a postcode on a map.
9. Join two datasets together using postcodes as the common key - where each postcode is located on a map (OS Code Point), how many households are in each postcode (p002). This provies a complete dataset with location and total household counts for every postcode.
10. Find affected postcodes: Use the 500m buffer around each street work and check which postcodes fall inside that area. If your postcode is in the area, you’re affected by the disruption.
11. Sum up the impact: Count all the households from all the postcodes inside each buffer arsa. For example, if 5 postcodes fall within a work’s buffer area, and they have 50, 75, 100, 25, and 30 households each, that’s 280 households disrupted by that one street work.
12. Apply the formula: £2.10 × Duration (days) × Households Affected = Monetary wellbeing impact per permit.
13. Aggregate and sort: Now each permit has an individual monetised impact, group results by promoter organisation, and local highway authority.
I’ve popped 2 simple visualisations below to help illustrate what I mean.
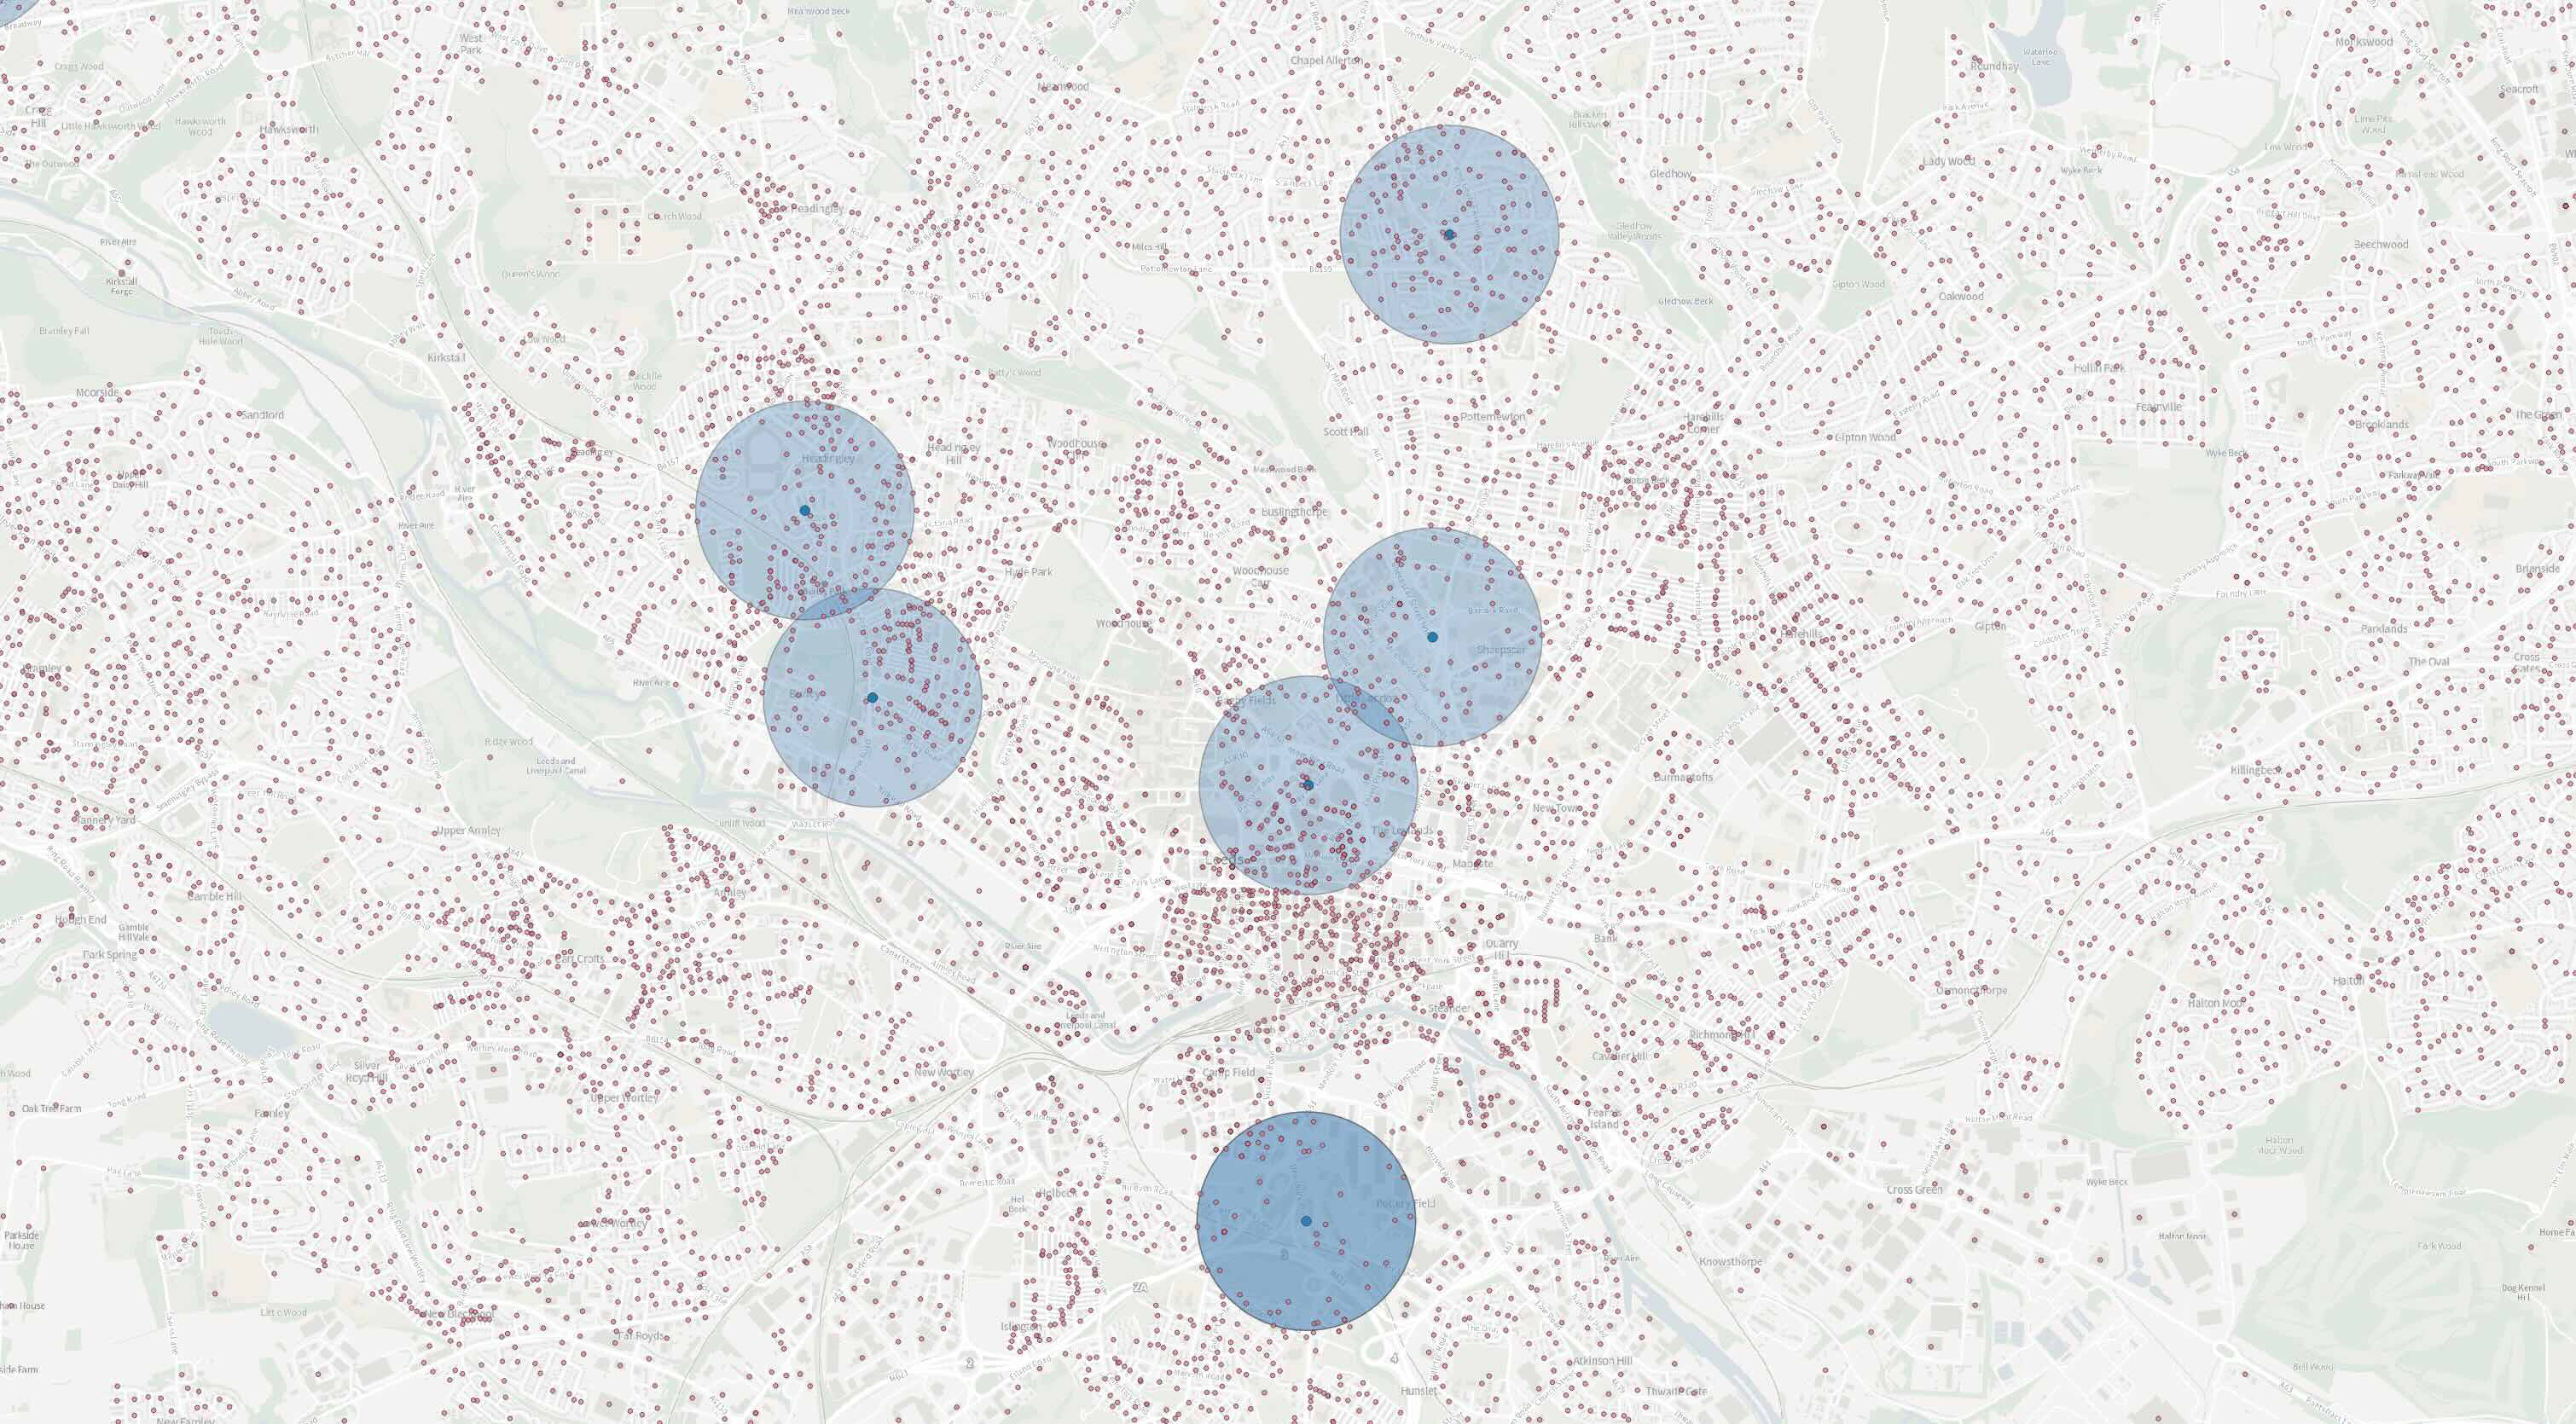 A small subset of completed major works in Leeds from September 2025 - a 500m circular buffer has been applied. The works are surrounded by Code Point centroids.
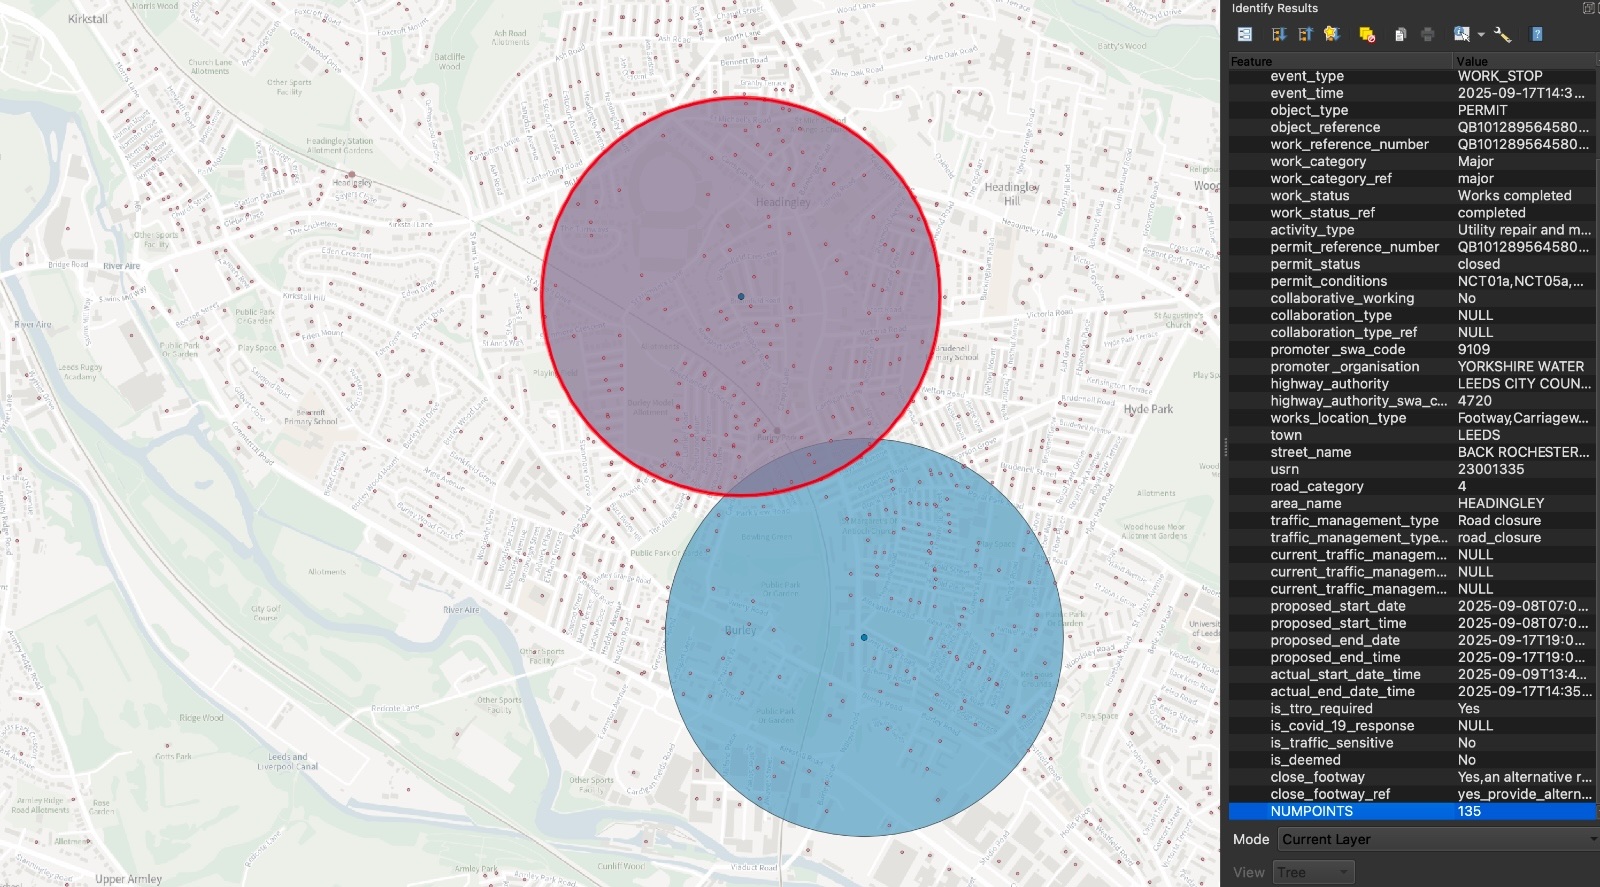 The number of Code Point centroids that fall within the 500m buffer - in this case 135 (which makes sense as this is Headingley in Leeds). At this stage, I can now join the ONS household counts as well.
Now… imagine the above steps but conducted at scale, on all permit data, for every local highway authority in England each month.
I do this using a combination of:
- Python
- GitHub Actions (for the data pipelines)
- A cron job running on a Raspberry Pi
- SQL
- DBT (used to automate data models for analysis)
- DuckDB (the one, the only)
Once I have the data in a good state and I can run simple SQL queries to generate insights.
SELECT promoter_organisation,
       SUM(wellbeing_total_impact) AS wellbeing
FROM analysis.major_wellbeing_impact
WHERE highway_authority = 'LEEDS CITY COUNCIL'
GROUP BY promoter_organisation
ORDER BY wellbeing DESC;
For September 2025, this gives us…
Wellbeing Impact by Promoter Organisation (Leeds):
- Leeds City Council — £1,323,069.30
- Northern Gas Networks — £1,176,010.50
- Northern Powergrid — £754,126.80
- Yorkshire Water — £650,235.60
- Network Rail — £56,618.10
- BT — £30,139.20
- Vodafone Group — £10,817.10
- National Highways — £9,895.20
- Last Mile Electricity Limited — £8,416.80
A quick note for context:
It’s important to emphasise that the aim of this analysis isn’t to paint utility companies or local authorities in a bad light. The essential work they do keeps our infrastructure running, and we all depend on it every single day.
Rather, this methodology is designed to provide insights that can help organisations make more informed decisions - particularly when it comes to collaboration.
In areas with high estimated wellbeing impacts, there may be extra incentives for utility companies to coordinate their works more effectively, reducing cumulative disruption to residents.
This is an estimation based on open data and an established methodology. It’s meant to provide food for thought in decision-making processes, not to serve as a definitive measure.
The goal is to support better planning and collaboration across the sector.
Looking at the data, it follows largely what you’d expect!
Larger utility companies such as Yorkshire Water, Northern Gas, and Nothern Powergrid often carry out major works to upgrade and repair their networks.
Leeds as a Local Highway Authority will be conducting highway maintenance and improvement programmes throughout the year.
Section 50s:
Section 50s are often logged under the local highway authority. This often includes works such as EV charge point installations and Heat Network infrastructure.
Leeds is currently building out its heat network, which might explain the high wellbeing impact for September 2025.
The data sources that make it work…
- Street Manager (open permit data only) — Who did the work, where did it happen, when, and how long did it take.
- OS Code Point — Where each postcode is on a map.
- Census 2021 P002 — Number of households per postcode.
Links to the data sources:
Conclusion and Future Improvements
There we have it… how you get from a big fuzzy mess to less of a fuzzy mess!
The aim of this was to show how we can boil data right down to concrete answers quite quickly.
Some ideas for future improvements:
- USRN to UPRN mappings: Use UPRN centroids instead of postcode household data. Geospatial buffers are never 100% accurate, and USRNs have a one-to-many mapping to UPRNs which might be more precise - although this goes slightly beyond just “households” and captures addressable locations instead.
- Variable buffer ranges: Play with the buffer ranges and adjust the £2.10 figure based on different distances (250m, 500m, 750m, 1000m). Look at multiple buffer zones to see how distance affects impact.
- USRN Centroids: Each permit is atrributed with a USRN. The work location coordinates from Street Manager can sometimes be slightly off. I could calculate the centroid of the USRN geometry and produce the buffer from that instead.
- Deprivation weighting: Apply Indices of Multiple Deprivation to this as an extra weighting factor.
- Relies on Census 2021 P002 data: Good for estimations but obviously gets more out of date as time goes on.
Chris
Data Licensing
Contains OS data © Crown copyright and database right 2025 (mapping layers and USRN data).
All data licensed under the Open Government Licence v3.0 (Street Manager data).